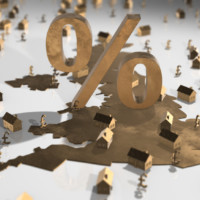
However, in contrast to the trend for much of the past decade, property price growth was the strongest across the Midlands and Northern England
According to the index, growth rates showed a marginal increase from 2.7% in Q2 to 4.0% in Q3 2017. With the standardised house price in the UK now at £224,201 – an increase of £8,702 since Q3 of 2016.
With the steepest increases, Northern markets and the Midlands continue to challenge the North-South divide. At 9.1%, the North of England saw the strongest rate of year-on-year growth – followed by the 7% jump in the East Midlands and 6.8% in the North West.
In comparison, London was the weakest region with a 2.6% rise. And with 3.8% increase, prices in the South East have for the first time in three and a half years risen at a softer pace than the UK as a whole.
Property prices in London (£451,328) and the South East (£343,159) remain the highest in the UK.
Cash values
In cash terms, UK properties have risen by £62,991 over the past five years. However, compared to the pre-crisis peak in Q3 2007, prices have only increased £23,578 — or an 11.8% change.
By contrast, in the decade between Q3 1997 and Q3 2007, standard house prices across all 12 regions in the UK more than doubled.
Although annualised data indicate subdued growth, short term price rises have gained momentum quarter-on-quarter: the quarterly upturn hit 0.9% in Q3, slightly higher than the 0.5% rise seen in Q2.
Commenting on the figures, senior economist at IHS Markit, Tim Moore, said: “Assuming property prices continue their recent upward trajectory in Q4, the standard UK house price will finish 2017 around 2-3% higher than at the end of last year.”
Moore added: “However, the 4% annual increase in UK property prices is flattered by comparison against a relatively weak Q3 in 2016 following the EU referendum.”