The average salary multiple required to buy a home in the two countries more than doubled to 7.6 times from 3.6 times between 1997 and 2016.
This has become most acute for first-time buyers who face “Herculean challenges” to afford their first home.
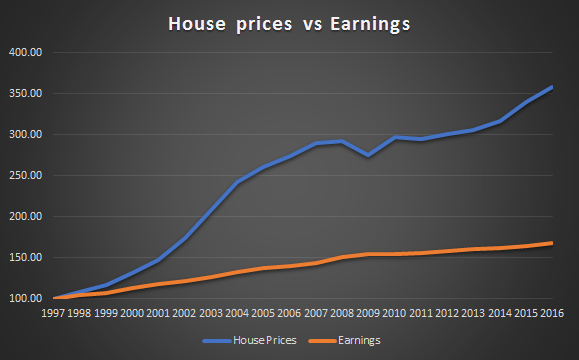 During this period, the median price paid for a residential property increased by 259% while median individual annual earnings increased by just 68%. (Click graph to expand.)
The gap between the least affordable and most affordable parts of England and Wales has also increased over the last two decades with housing affordability worsening in all local authority districts.
“Extremely worrying”
Search Acumen director Andy Sommerville was alarmed at the figures.
“Evidently, the 21st century has seen homeownership pushed far into the distance for many young professionals but we are now in danger of generation rent encompassing house hunters of all ages,” he said.
“The huge gap between earnings and affordability is extremely worrying. Prospective buyers are more stretched to buy property in every single local authority than they were before the turn of the millennium.
“It is not simply the fault of wages, it is down to the gaping hole between demand and supply in our property market.”
However, Somerville was hopeful that policy was moving in the right direction.
“Various policy announcements over the past months have given some reassurance that this is on the government’s agenda, however Philip Hammond’s radio silence when it came to housing in the latest Budget led to some criticism from the industry. It is now up to the construction industry and the mortgage lenders to kick-start the recovery of our problematic sector and pave the way for a healthier and sustainable housing market,” he added.
Regional differences
 Unsurprisingly, housing affordability has worsened fastest in London boroughs over the last two decades.
The most affordable local authority in 2016 was Copeland in Cumbria, with house prices being on average 2.8 times greater than annual earnings.
In contrast, Kensington and Chelsea was the least affordable with house prices being 38.5 times greater than annual earnings.
Young hardest hit
Private Finance director Shaun Church said buyers are having to find new solutions to get on the ladder.
“The yawning gulf between earnings and house prices highlights the extent to which the affordability crisis is worsening across the country,” he said.
“Younger would-be buyers are the biggest losers from the growing imbalance between house prices and earnings. The data reveals that in 1997 the average house price was just 3.6 times the average income, which would have been well within reach of a young couple looking to buy. The same couple looking to buy today would face an uphill struggle, and many find now themselves looking to their parents for help with a deposit or to act as a mortgage guarantor.
“Such an imbalanced situation creates obvious temptations for policymakers to interfere with the market. However, it is absolutely imperative that they avoid destabilising the housing market for political ends, as was the case with the changes to Stamp Duty last year,” he added.