
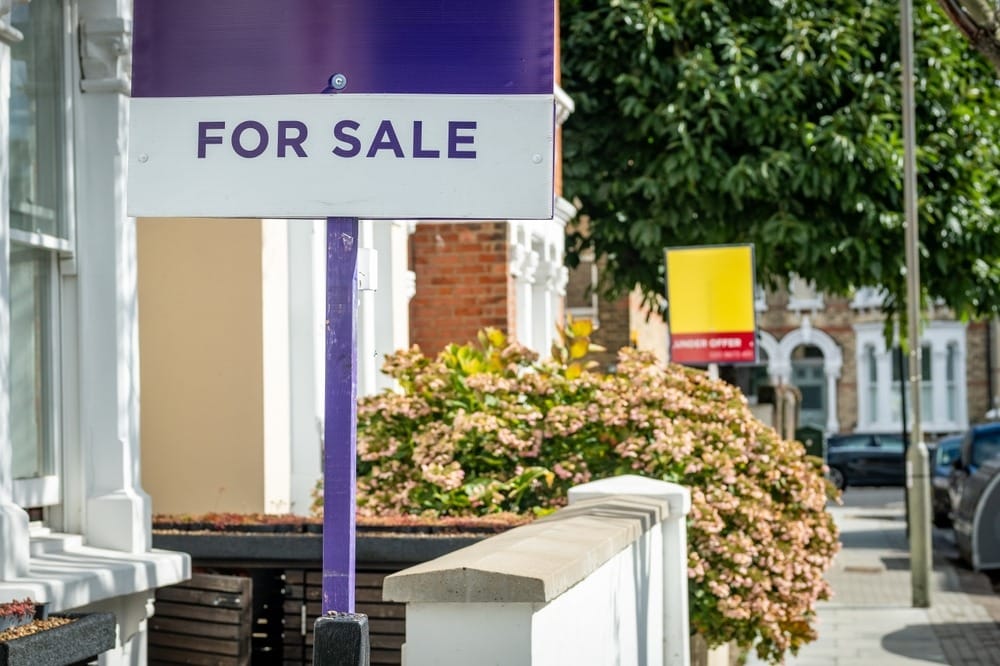

With fewer buyers searching the market for a new home, the number of property sales agreed has dropped 7% below last year, according to Zoopla’s latest house price index.
Three in five homes listed for sale since January are yet to find a buyer. Property types still selling well are two- and three-bedroom houses, which across the country are selling at a similar pace to last year.
One- and two-bedroom flats remain the weakest market segment, as over two-thirds listed this year remain unsold. Zoopla said that with first-time buyers being the typical audience for these properties, this reflects their exposure to higher buying costs and subsequent step back from the market.
An increase in mortgage rates in April has added £232 to the average first-time buyer’s costs in London. For first-time buyers in the North East, where property prices are lower, the rising cost of borrowing has had a less pronounced impact, with £66 added to the average monthly mortgage payment.
Higher borrowing costs, along with a change of Prime Minister and questions over future tax and spending priorities in the Autumn Budget, have added to households’ uncertainty over whether now is the right time to move.
£2.5m paid to help broker clients benefit from greener homes
Sponsored by Halifax Intermediaries
Meanwhile, house price inflation has slowed to 1.4% year-on-year. Prices were increasing by 3.5% in the North but falling in London for the ninth consecutive month.
Falling demand
Some regions have suffered steeper declines in demand than others. Of the 11 regions (including Scotland and Wales) monitored by Zoopla, seven experienced a decline in buyer demand that exceeded the UK average of 15%. The top five were the West Midlands (30%), the North East (29%), the East Midlands (22%), Wales (19%) and Scotland (18%).
London saw the lowest fall in demand at 12% – the only area to fare better than the national average.
Interest rates add up
With mortgage rates hitting 5% in April, according to Bank of England monthly average five-year fixed rates for new business, would-be buyers are facing an extra £125 monthly on top of the average mortgage – adding up to £1,500 per year, Zoopla’s analysis revealed.
However, rate rises are hitting buyers very differently depending on their location, which explains why sales agreed have fallen more sharply in some areas than others.
For example, London buyers have seen their mortgages increase by £244 per month (£2,900 per year), compared to those in the North East, whose buyers have seen an increase of just £69 per month (£830 per year). First-time buyers have also been hit – with London’s first-time buyers seeing a monthly increase of £232, which is nearly three-and-a-half times the £66 monthly increase facing a first-time buyer in the North East.
However, mortgage rates have already started to fall, edging lower in May to 4.8%.
Richard Donnell, executive director at Zoopla, said: “It’s a buyer’s market across much of the South right now, but motivated sellers in Northern England and Scotland are still finding buyers at broadly last year’s pace, which shows the housing market is not moving at one speed.
“The national picture can only tell you so much, and local market conditions vary considerably across the country. The most important step, whether you are buying or selling, is speaking to a local agent who knows what is actually happening on your street.
“For sellers still waiting for an offer, the conversation to have is about price. Correctly priced homes are selling, while overpriced homes are sitting. For buyers, rates are falling, there is more choice of homes for sale than a year ago and motivated sellers are willing to negotiate. If you are ready to move, conditions are more favourable than they were three months ago.”
|
Region/country |
Buyer demand |
Stock of homes for sale |
Flow of new homes for sale |
Sales agreed |
|
East Midlands |
-22% |
4% |
-5% |
-11% |
|
East of England |
-15% |
5% |
5% |
-10% |
|
London |
-12% |
9% |
-4% |
-9% |
|
North East |
-29% |
3% |
-9% |
-3% |
|
North West |
-15% |
-4% |
-7% |
-6% |
|
Scotland |
-18% |
-4% |
-5% |
-4% |
|
South East |
-15% |
4% |
-2% |
-7% |
|
South West |
-17% |
4% |
-3% |
-10% |
|
Wales |
-19% |
-7% |
-8% |
-12% |
|
West Midlands |
-30% |
3% |
2% |
-8% |
|
Yorkshire and the Humber |
-16% |
1% |
5% |
-5% |
|
UK |
-15% |
2% |
-2% |
-7% |
Source: Zoopla research