The estate agent also warned that it did not believe current levels of house price growth were sustainable against the expected backdrop of inflation and zero wage growth over the next couple of years.
Savills noted that the effects of the 3% Stamp Duty surcharge on additional homes in April 2016 were becoming clearer as shown by Council for Mortgage Lenders’ data, which found that in the second half of 2016 homemover numbers fell by 8% compared to the same period in 2015, while first-time buyer numbers increased by 7%, placing the two types of buyer neck and neck.
“Homemover numbers have clearly been suppressed by increased mortgage regulation, constraining the amount aspiring upsizers can borrow, but we believe these numbers also point to another trend – a change in the behaviour of the bank of mum and dad,” said Savills research associate director Chris Buckle.
“Parents are now less likely to help their children access the market by co-buying a property, which would incur the 3% additional home Stamp Duty charge, but give a cash injection instead.
“As a result, these purchases are recorded not as home mover activity, but further boost first-time buyer numbers already inflated by government schemes such as Help to Buy,” he added.
 Divided country
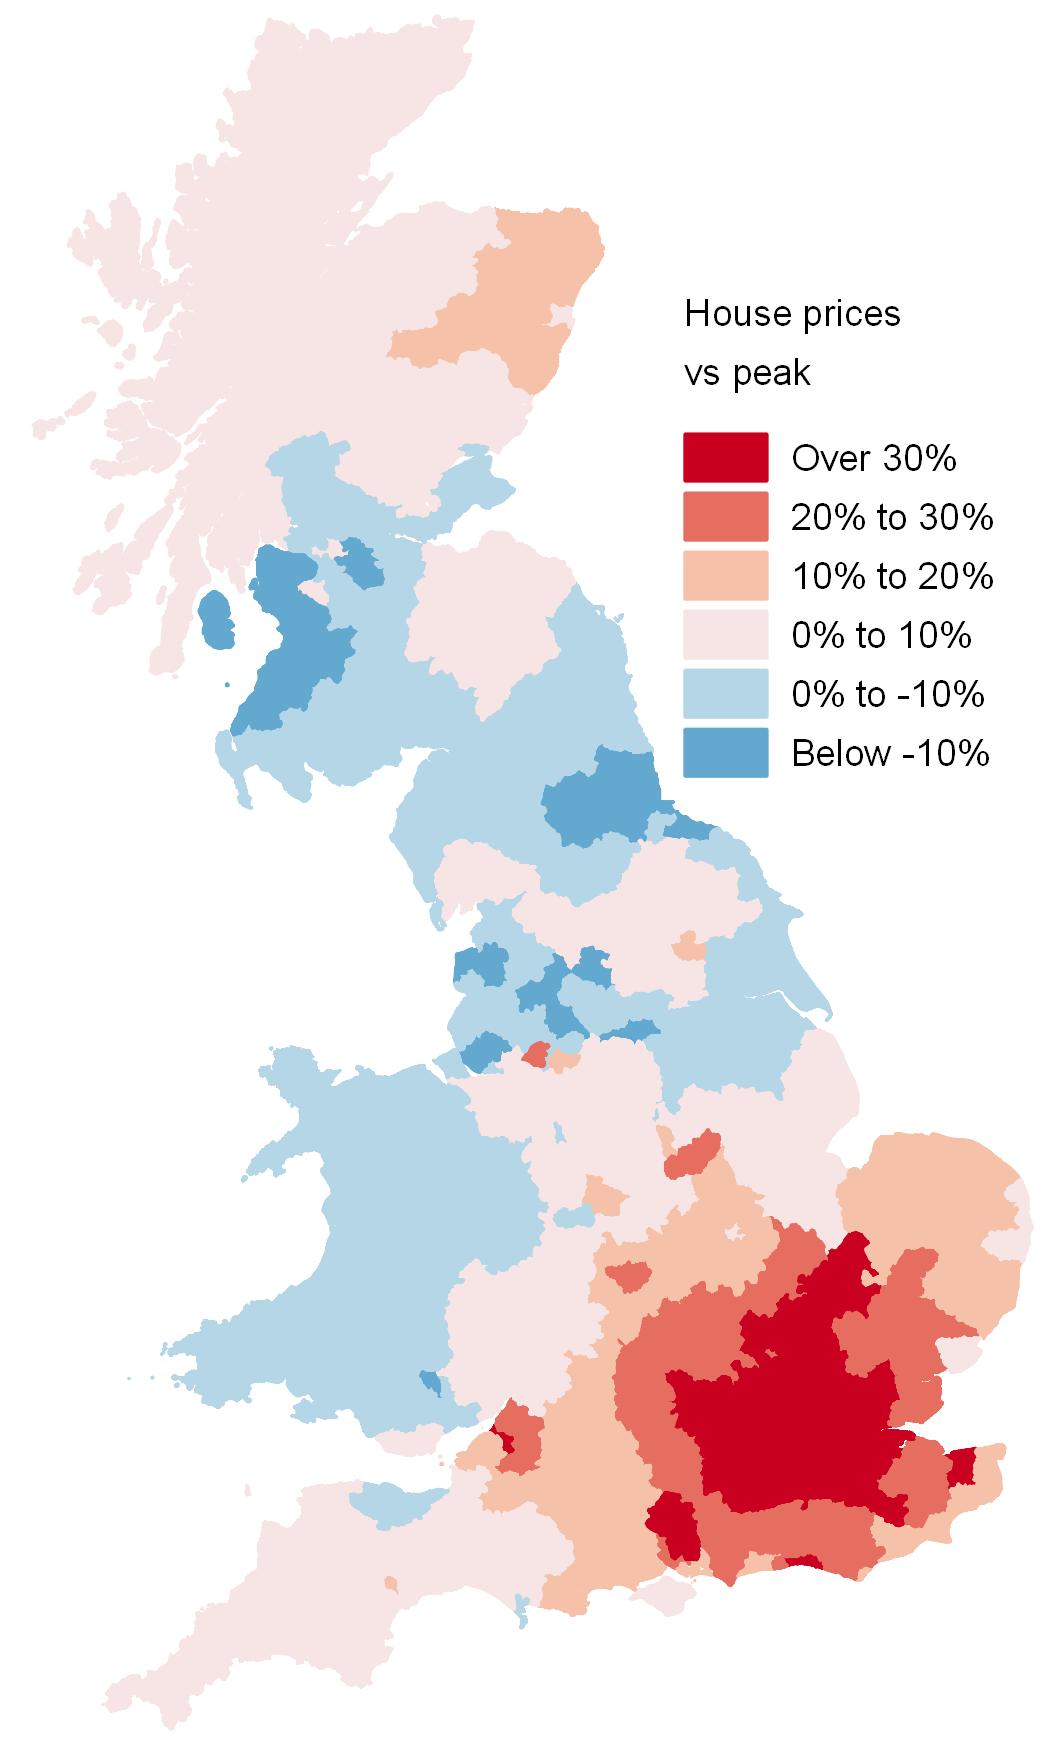
Analysis by Savills of Land Registry and Registrars of Scotland data also shows the stark divide in the UK housing market since its peak in 2007-2008 and the end of 2016 (right).
The graphical representation reveals how properties in the south east of England and several other city areas have soared by more than 30%.
In contrast, in much of the north, Wales and south west Scotland prices have yet to recover with some areas still being more than 10% below their peak levels.
Annual growth
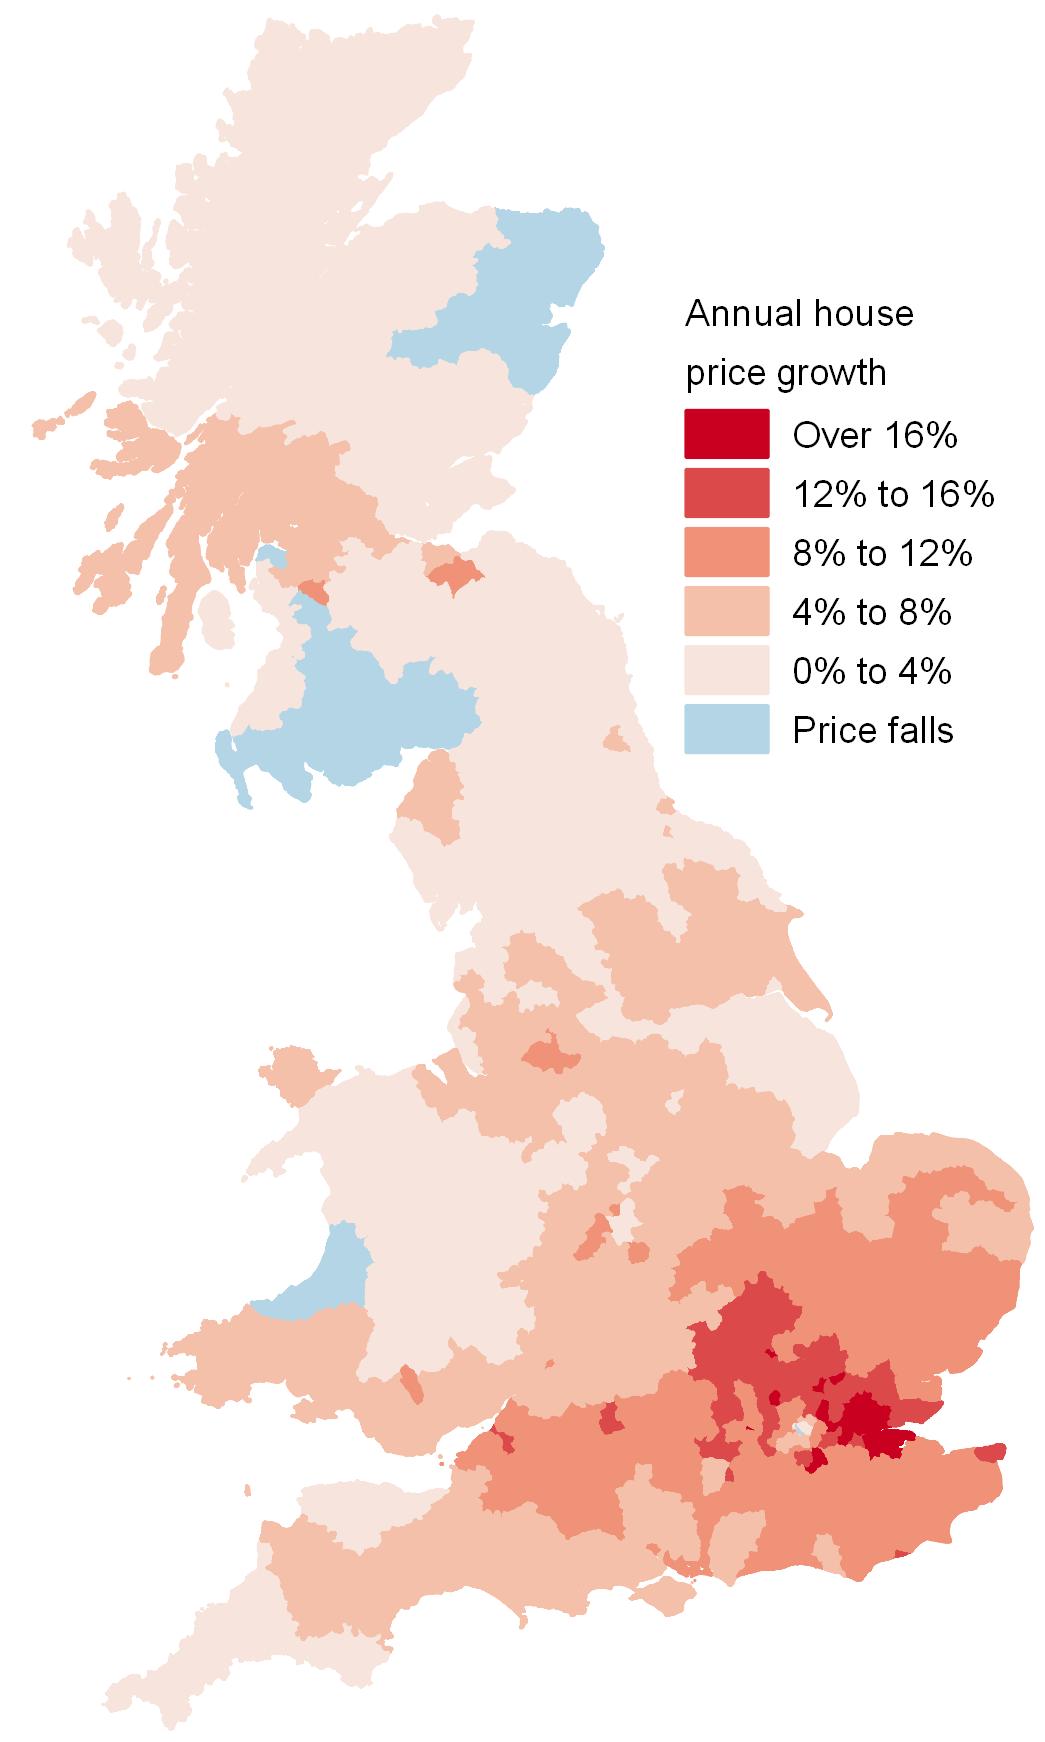 The map for 2016 alone (right) shows a similar pattern with most of the house price growth concentrated in the south east – Slough, Newham, and Thurrock the top three authorities in terms of annual house price growth.
However, fewer areas witnessed falls indicating that the rest of the country may be beginning to recover.
It was notable that Kensington and Chelsea saw the only annual price fall in England over the same period.